News
Analysis of climate anomalies in Croatia in 2016
Analysis of annual air temperature and precipitation anomalies
The average annual air temperature in Croatia in 2016 was above the multiannual average (1961 - 1990). Average annual air temperature anomalies, shown in Figure 1, were within a 0.8°C-1.9°C range.
According to percentile ranks and classification ratings, thermal conditions in Croatia in 2016 dominantly fall into the extremely warm category, with wider areas of the towns of Knin, Daruvar and Sisak fall into the very warm category.
An analysis of annual precipitation amounts in 2016 expressed as percentages (%) of 1961 - 1990 average, shown in Figure 2, indicates that precipitation amounts in Croatia at most meteorological stations encompassed by the analysis were above average. A comparison with the multiannual average reveals that the precipitation amounts in 2016 were within the range of 70%-131% of the above mentioned average. The wider area of the town of Sisak, parts of eastern Croatia, the wider areas of the towns of Gospić and Ogulin, and parts of northern Adriatic fall into the wet category. Parts of northern Adriatic are in the very wet category, and parts of central and southern Adriatic in the dry category. The rest of Croatia is in the normal category.
The above analyses reveal that 2016 was extremely warm in 80% of Croatian territory and very warm in the remaining 20%. Wet weather was prevalent in 30%, dry weather in 15%, and extremely wet weather in 10% of Croatian territory. The weather in the remaining 45% of Croatian territory is classified as normal.
Analysis of daily air temperature and precipitation amount anomalies for meteorological stations Zagreb-Grič and Split-Marjan
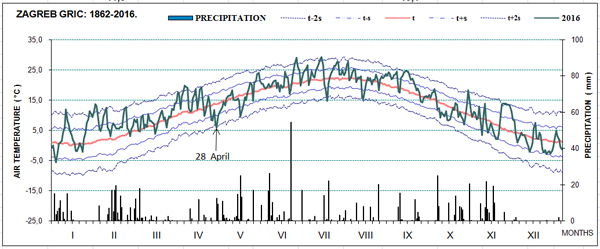
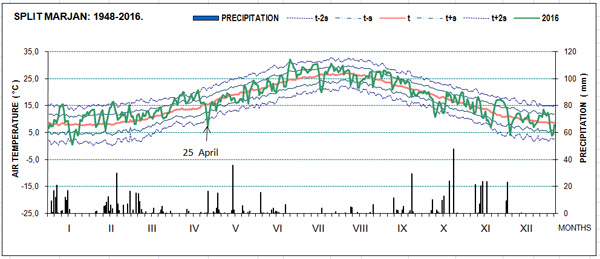
Croatian Meteorological and Hydrological Service has a standard operational practice of doing an evaluation of extremeness of average daily air temperatures for every month of the year based on the well-known Chapman's criterion and on the assumption that the daily temperature averages for every date and location obey a Gaussian distribution (Penzar and Makjanić, 1980). Chapman's criterion defines an extremely warm day as a day with a positive average daily temperature anomaly exceeding two standard deviations, and an extremely cold day as a day with a negative anomaly exceeding two standard deviations. Extremely hot and extremely cold days have a probability of occurrence of around 2%. That is to say, such events on average occur twice in 100 years. Figures 3 and 4 also show extremely hot and cold days registered in 2016 at meteorological stations Zagreb-Grič and Split-Marjan. A visual assessment brings us to the conclusion that periods with positive anomalies prevailed, resulting in the positive annual anomalies shown in Figure 1. However, there were some cold waves, the one in the last dekad of April having been the most intensive. It caused considerable damage in the economy and will be addressed separately.
Figures 3 and 4 also show daily precipitation amounts at meteorological stations Zagreb-Grič and Split-Marjan. As seen in Figure 2, the sum of daily precipitation amounts at Zagreb-Grič in 2016 is close to the multiannual average, however, the daily precipitation amount in June exceeded 50 mm. A more pronounced lack of precipitation was recorded in March and December. The total annual precipitation amount at Split-Marjan was below average with a dry period from March to September and another in December.
The cold spell at the end of April 2016
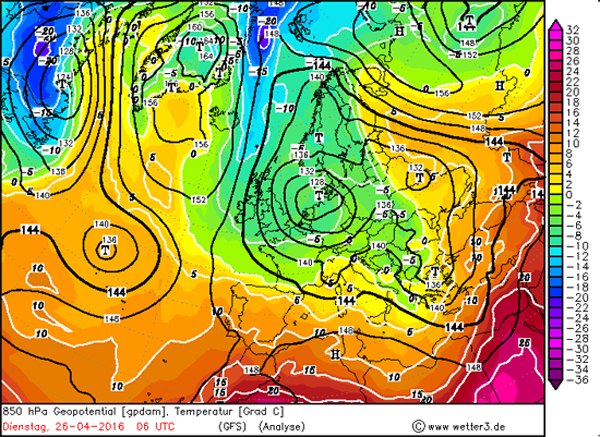
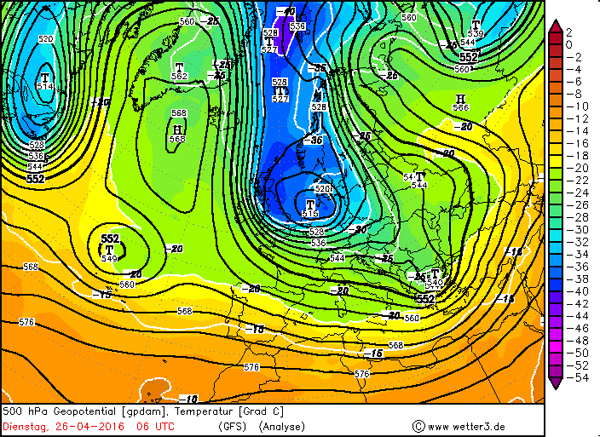
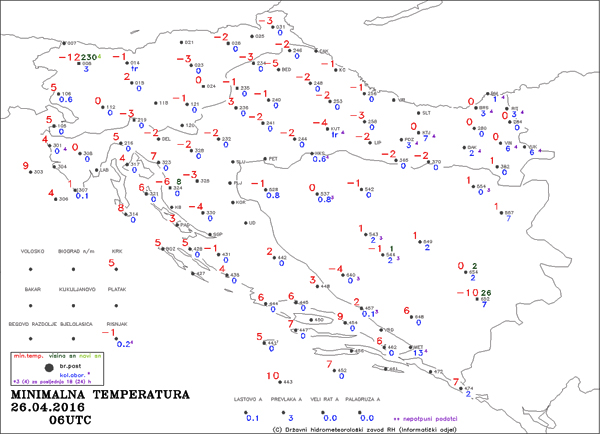
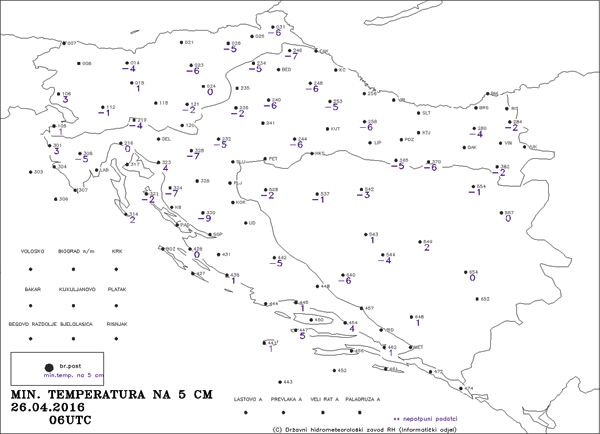
An inflow of cold air over Central and Western Europe caused a sudden drop in air temperatures during the third dekad of April 2016. The polar air reached central Europe and the Alps on 24 April, causing minimum daily air temperatures to drop below 0°C in many parts of Germany and north-eastern France. On 25 April, the cold air mass with negative temperatures arrived in Austria and affected major parts of the Czech Republic, Poland, and the Baltic countries. The following day (26 April) was characterised by negative temperatures in Austria, Poland, Slovakia, the western half of Hungary, Slovenia, Croatia and locally in the central Balkan regions (JRC, 2016). The cold-core low with the relatively cold air in the 850 hPa isobaric surface, which encompassed most of northern, western and central Europe, is shown in Figure 5. Figure 6, which shows the isohypses and isotherms in the isobaric surface AT 500 hPa on 26 April 2016 at 06 UTC, reveals the break of very cold polar air across Western Europe in the north-western upper-air stream flow toward territory of Croatia. Most continental meteorological stations in Croatia registered a very cold day on 26 April, with a minimum daily air temperature below 0°C (Tmin < 0°C) (Figures 6 and 7). Many meteorological stations in Croatia registered frost on that day. Frost affected north-western, central and part of eastern Croatia, as well as the hinterland of the east coast of the central Adriatic, causing serious damage in orchards and vineyards (Figure 9). Frost damage in fruit farming across Croatia was estimated to more than 105 million Euros. Several counties declared a state of natural disaster.

References:
Penzar, B. i B. Makjanić, 1980: Osnovna statistička obrada podataka u klimatologiji. Prirodoslovno-matematički fakultet, Zagreb.
JRC, 2016: Crop monitoring in Europe. JRC MARS Bulletin, Vol. 24, No. 5